The sales floor, live.
Overdrive Performance puts every consultant's numbers on their Salesforce home page: CVs sent, interviews, placements and revenue, each against a target. Leaderboards, head-to-head battles, team sprints and incentives turn those numbers into something the whole floor chases. Sales teams use it the same way for their reps.
From your Salesforce data to a live leaderboard.
Performance reads the work your team already logs. We set up your core metrics with you, then the numbers update on their own.
Connect your Salesforce
We install Performance in your Salesforce with you. It reads the records your team already logs, so there's nothing new to fill in.
Onboarding call · No new data entryPick your metrics
CVs sent, interviews, placements, revenue or anything else you count, on standard or custom objects. Set targets per person and per period.
Your objects · AI metric builderEveryone sees live stats
Each consultant's numbers sit on their own home page, and the leaderboards move as the work is logged.
My Stats · Leaderboards · Team viewCompete and win
Head-to-heads, team battles and incentives give the floor something to chase, on screen and on the office TV.
Battles · Incentives · TV mode
Numbers everyone can see, and a reason to beat them.
The screens below are the real product running on a demo team, apart from the three marked as examples.
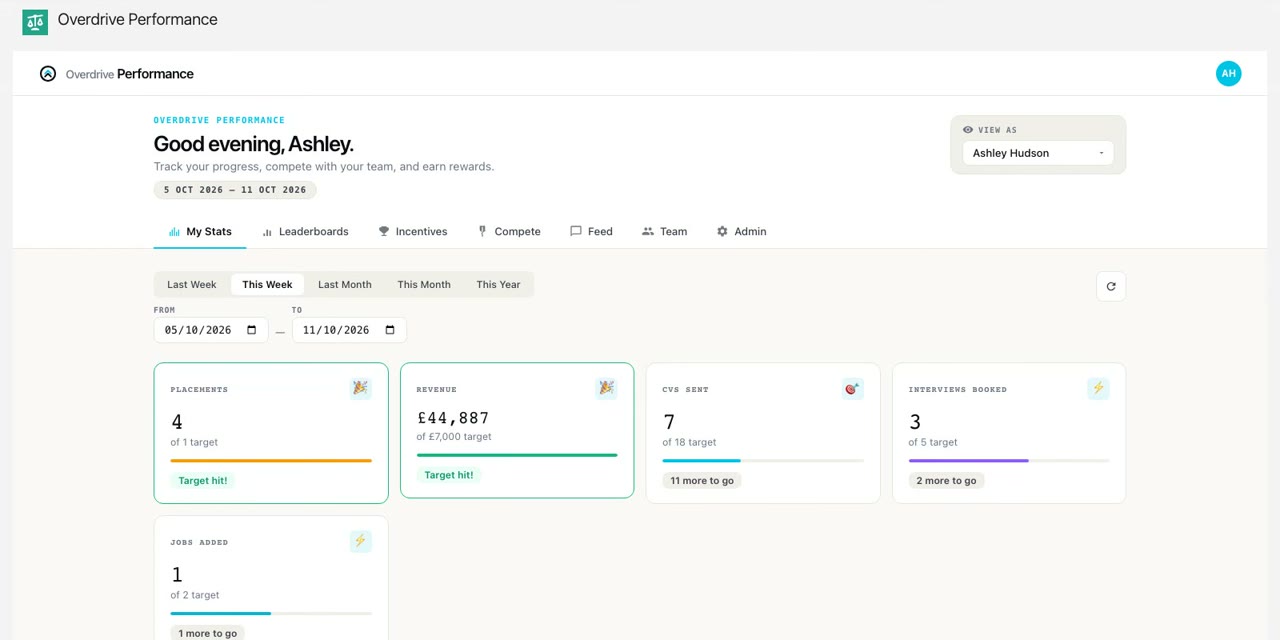
Every consultant sees their numbers, live.
Each person gets their own stats in Salesforce: CVs sent, interviews booked, placements, revenue and jobs added, each against a target with a progress bar. Hit a target and it says so.
- A target for each metric and each period
- This week, last week, this month, this year or any date range
- Badges for the milestones that matter to your team
- Metrics built on whatever your team logs in Salesforce
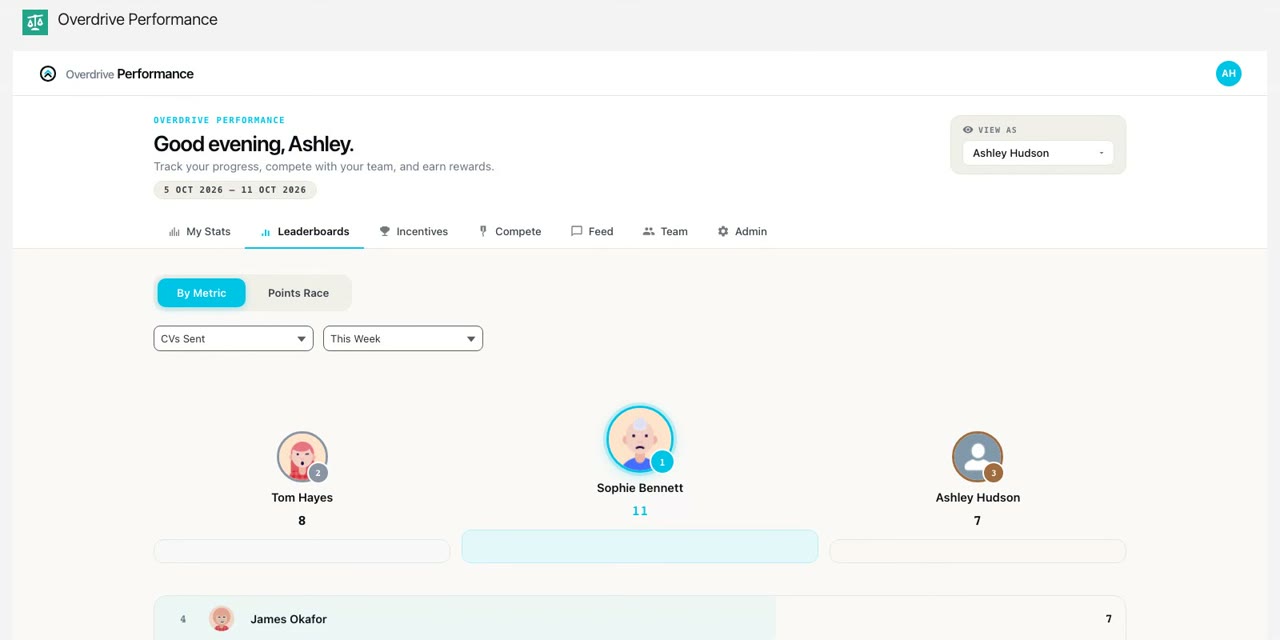
Leaderboards for any metric.
Rank the team on a single metric, or run a Points Race that scores several metrics at once. The top three get a podium and everyone else gets a place on the board.
- By Metric or Points Race
- Any period, from this week to your own date range
- CVs sent, interviews, placements, revenue or your own metrics
- Everyone sees where they stand
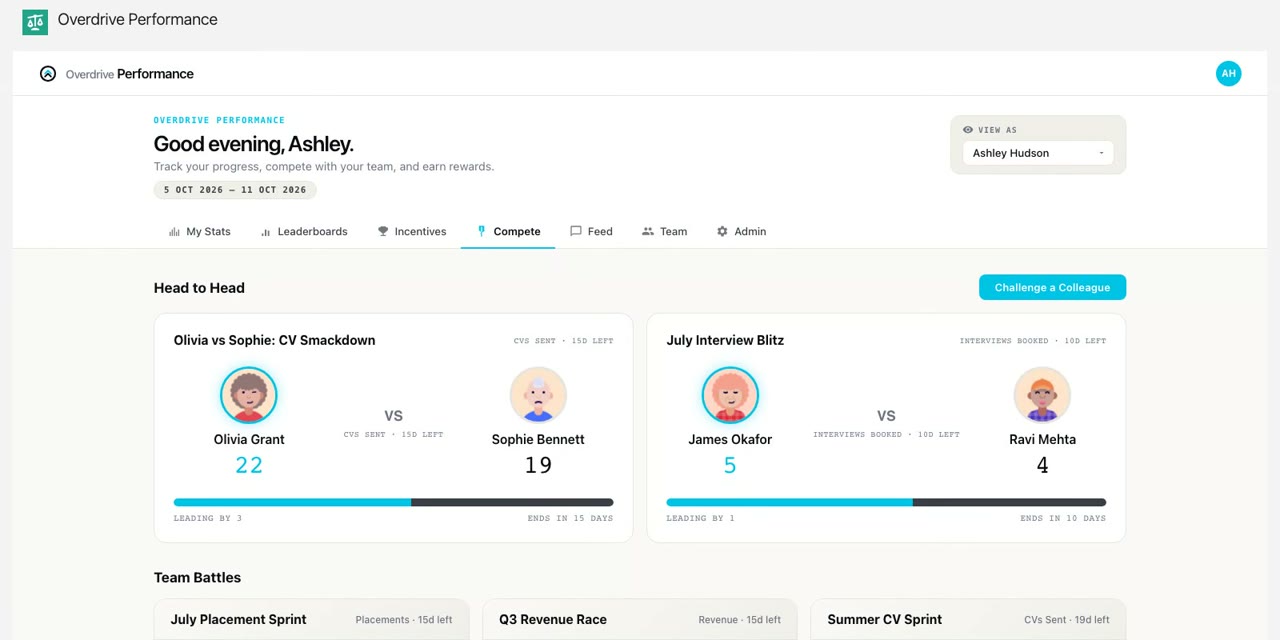
Head-to-head battles and team sprints.
Challenge a colleague to a head-to-head on any metric, or run a team battle such as a monthly placement sprint. Scores update as the work is logged, and every battle shows who's leading and how long is left.
- Head to head: pick the metric, the dates and the people
- Team battles for the whole floor
- Live scores and days remaining on every battle
- Battles can rotate on the office TV
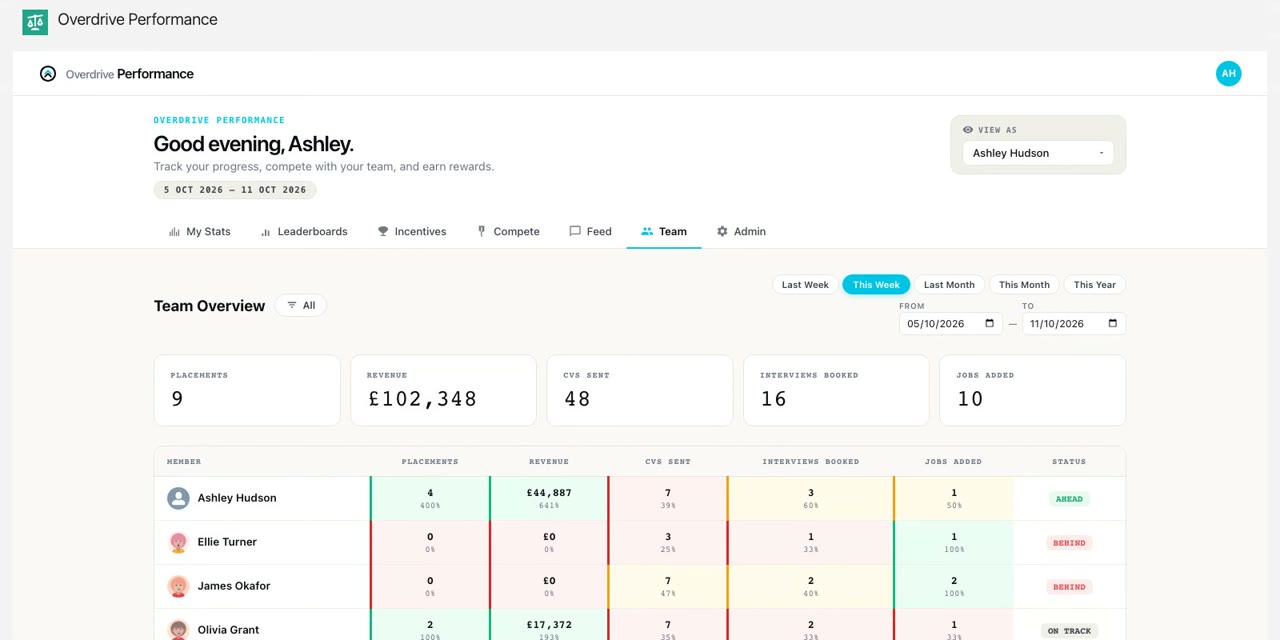
The whole team at a glance.
Managers see everyone's numbers side by side in one heat map, each cell coloured by progress against target, with ahead, on track or behind for each person.
- One row per person, one column per metric
- Cells coloured by progress against target
- Ahead, on track or behind, at a glance
- Any period, including your own date range
Incentives people can watch themselves earning.
Set an incentive, such as a team trip or a quarterly bonus, tie it to a metric and a threshold, and everyone can see how close they are and how many days are left.
- Tied to any metric and threshold
- A progress bar and days remaining for each one
- Qualified and Almost there flags
- Add an image so the prize stays front of mind
Highest revenue in the quarter wins a weekend away for two.
Put the leaderboard on the office TV.
Build a playlist of slides and Performance rotates through them on the office screen. Pick the metric and period for each leaderboard slide.
- Slides for leaderboards, reports, battles, the activity feed and company goals
- Drag to reorder and set the rotation speed
- Weekly or monthly views per slide
- Included in every seat
Describe a metric. AI sets it up.
Type what you want to count in plain English and the AI metric builder works out where it lives in your Salesforce and configures it. The AI report builder does the same for ranked reports, such as CV to interview conversion.
- Plain English in, a working metric out
- Works with standard and custom objects
- Check the object, filter and name before you save
- Ranked reports, such as who sends CVs fastest on a new job
One simple price per seat.
Use Performance on its own, or add it to Engage and save 15% on each seat.
Everything on this page, including TV mode and the AI metric builder.
Questions about Performance
Something else? Email sales@overdrivehq.co.uk or see the pricing below.
Does Performance use our existing Salesforce data?
Yes. It's a managed package installed in your own Salesforce org, and it reads the records your team already logs, such as placements, CVs sent, interviews, jobs and revenue. There's no separate database to keep in step.
We use custom objects for placements and jobs. Will it work?
Yes. We set up your core metrics with you on an onboarding call, against the objects and fields you already use, standard or custom. After that you can add more yourself with the AI metric builder.
Can consultants see each other's numbers?
Yes, and that's the point. Leaderboards show everyone, and that visibility is what drives the competition. If your culture keeps numbers private, Performance isn't the right fit.
Is it only for recruitment agencies?
No. It was built for recruitment desks, but a metric is whatever you count in Salesforce, so sales teams use it for their reps' activity and results in the same way.
Do we need Overdrive Engage?
No. Performance works on its own. If you also run Engage, take both and save 15% on each seat.
Does the TV dashboard cost extra?
No. TV mode is included in every seat. Choose the slides, set the rotation speed and put it on the office screen.
See your own team on the leaderboard.
Live stats, leaderboards and competitions inside the Salesforce your team already uses.